I also want to use the ATT&CK Framework
If you want to improve the detections and the effectiveness of your SOC against attacks targeting your organization, the hottest thing right now is the ATT&CK framework and Threat informed defense.
However, if you don’t have the resources to hire external consultants to setup this for you, it can be overwhelming for small organizations to get onboard the ATT&CK ship.
I’m going to try and ease the process for you, the only prerequisite is that you know your organization, your own network and what you are logging right now. With that information on hand, I’m going to show you how to map that to ATT&CK TTPs and find the gaps in you detection infrastructure. After we finish with this series you can have a decent threat assessment based in real attackers data, and that only with your knowledge of your network and some amazing open source tools. The only expense will be in the coffee ☕ consumed while working on this .
DeTT&CT
DeTT&CT is an opensource tool that will help us with this task, it’s great and easy to use, although it can be hard to know how to start the first time if you are not familiar with how ATT&CK works, but I’ll show you just that, follow along with me.
I’d like to thank Marcus Bakker (Twitter: @Bakk3rM) and Ruben Bouman (Twitter: @rubinatorz), the authors of this awesome tool; thank you for making this available for everybody to benefit, and thank you for mantaining it updated with the new versions of the ATT&CK framework. They also have great documentation on the wiki, if you want to dive in it.
Installation
You can find the instructions in the wiki, but let’s do a quick install of the docker image. I assume you have a system, Linux or Windows, with Docker, then just follow this instructions.
Create 2 folders for the input and output files produced by the tool.
mkdir input;mkdir output
Pull the latest docker image:
docker pull rabobankcdc/dettect:latest
And run the container, mapping to a port in you host system - by default the editor uses 8080, so I use that one as well - and mount the folders input and output as volumes to save the files we create later.
docker run -p 8080:8080 -v $(pwd)/output:/opt/DeTTECT/output -v $(pwd)/input:/opt/DeTTECT/input --name dettect -it rabobankcdc/dettect:latest /bin/bash
And that’s it, now we should be inside the container and ready to start.
Data Sources
As I said earlier, starting with ATT&CK, even with the help of this tool, can be overwhelming, so let’s make it straight forward. We first want to know what we can see in our network - I’m assuming you have already some kind of log collection in place. But to know our visibility, we first need to assess the data we are collecting.
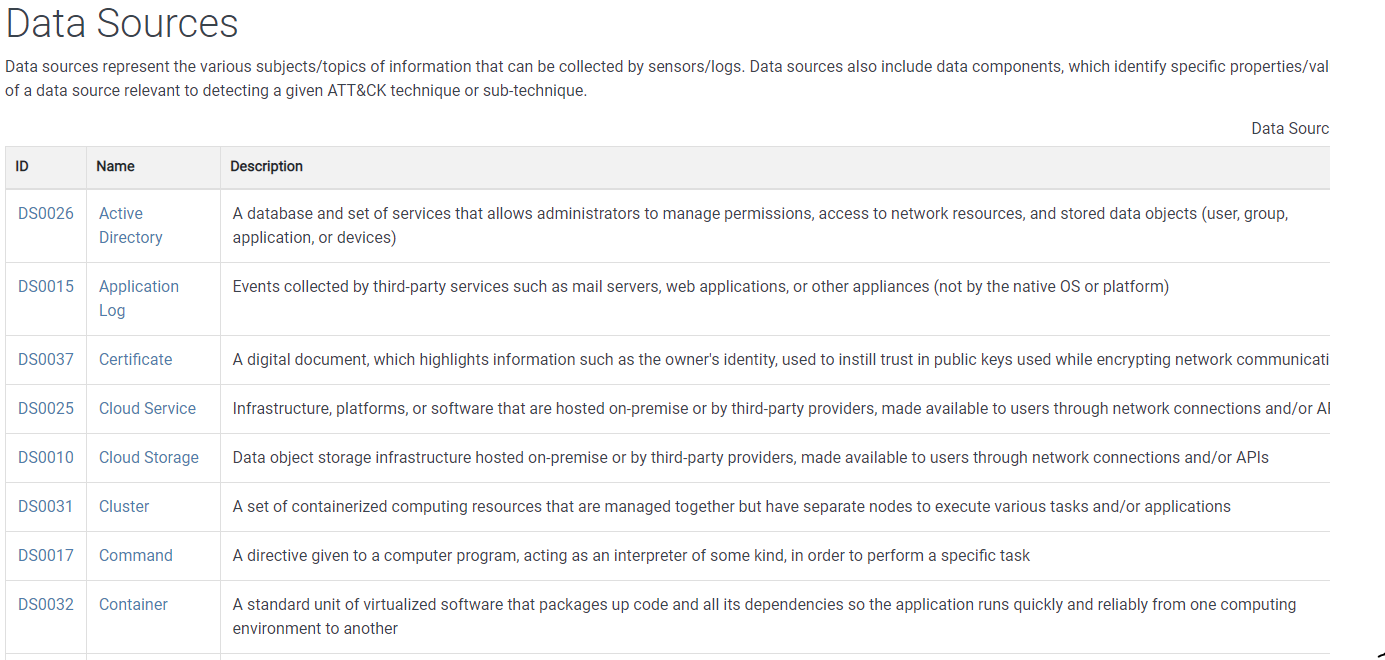
We are going to work with the data sources as defined in the ATT&CK framework, which you can see here. There are currently 38 data sources, themselves divided on data components, making it up to 90 different data points - as I said quite overwhelming to start with. Thankfully, in DeTT&CT we have all these preloaded and ready for us.
Start the DeTT&CT editor; from inside the container, run:
python dettect.py e
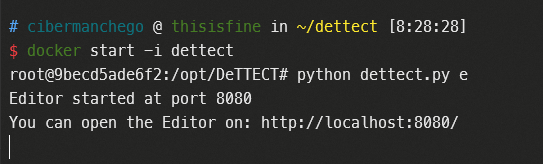
Now open in your browser the editor
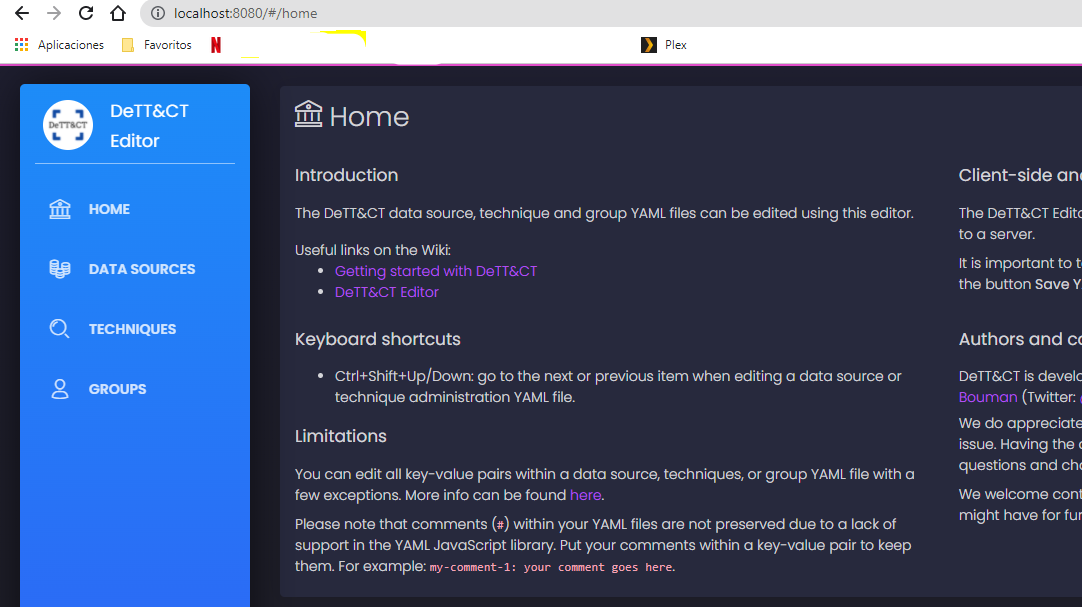
Click on Data Sources > New File and let’s start.
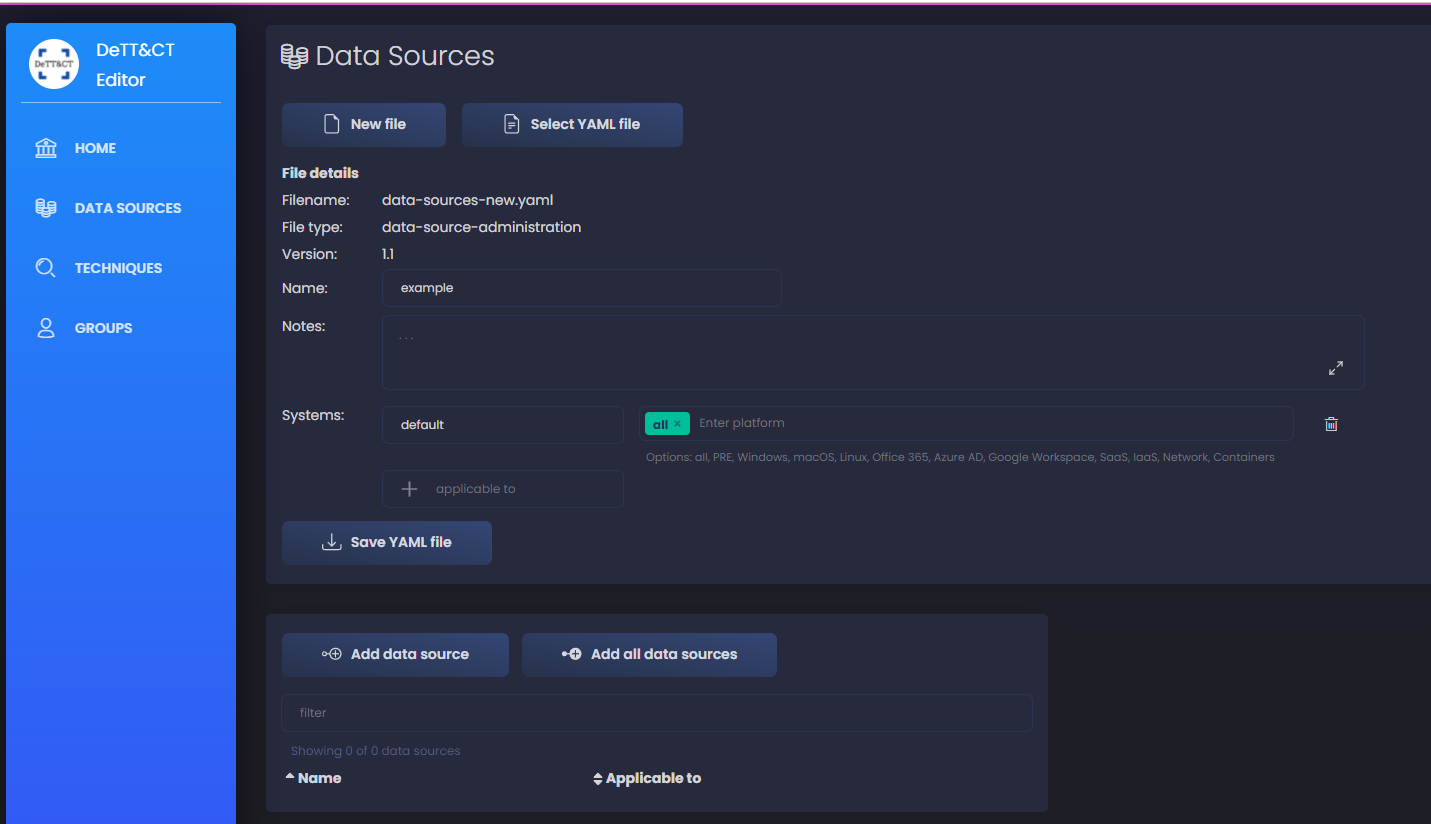
To start with, I’ll work only on Windows platform, to make it more simple in the beginning, but once you get the gist of it, you should to this for all platforms applicable to you network. You can also add systems separate for servers and workstations to add more granularity - in case some data sources are only collected for servers or vice versa. We can add more, like firewalls, routers, anything we have in our network. I input all the file details as you see in the screenshot below:
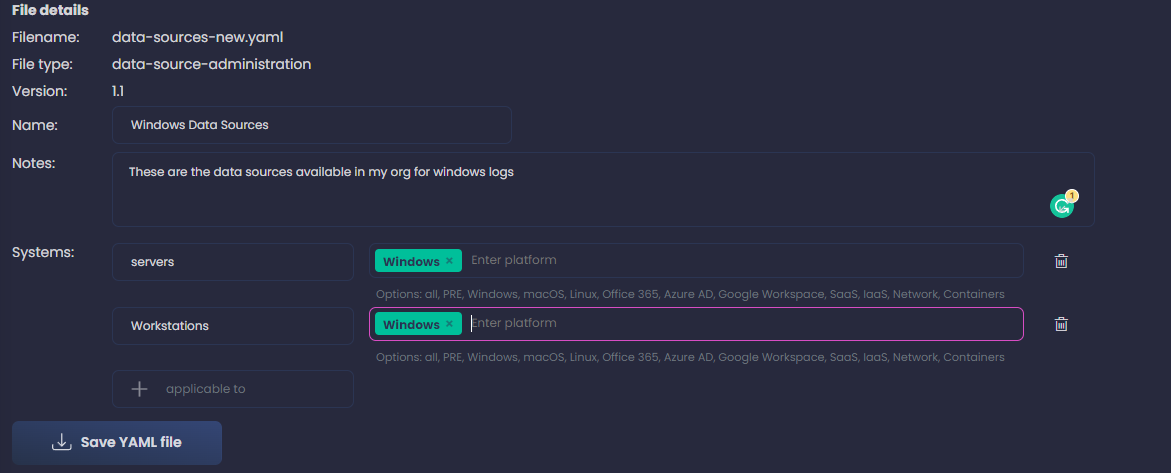
Remember, we want to include all data sources we are collecting, doesn’t matter if we have detections for them or not, just the fact that they are collected. If they are stored somewhere for later analysis - ideally a SIEM - we will also note that in following steps
We’ll use the data sources page in MITRE as reference, and it will help to understand if we are collecting something that includes a particular data source.
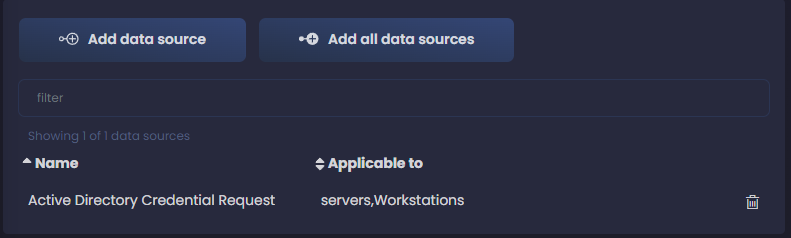
Now we click on the left on Add data source and a new windows appears to the right where we can start adding our data sources.
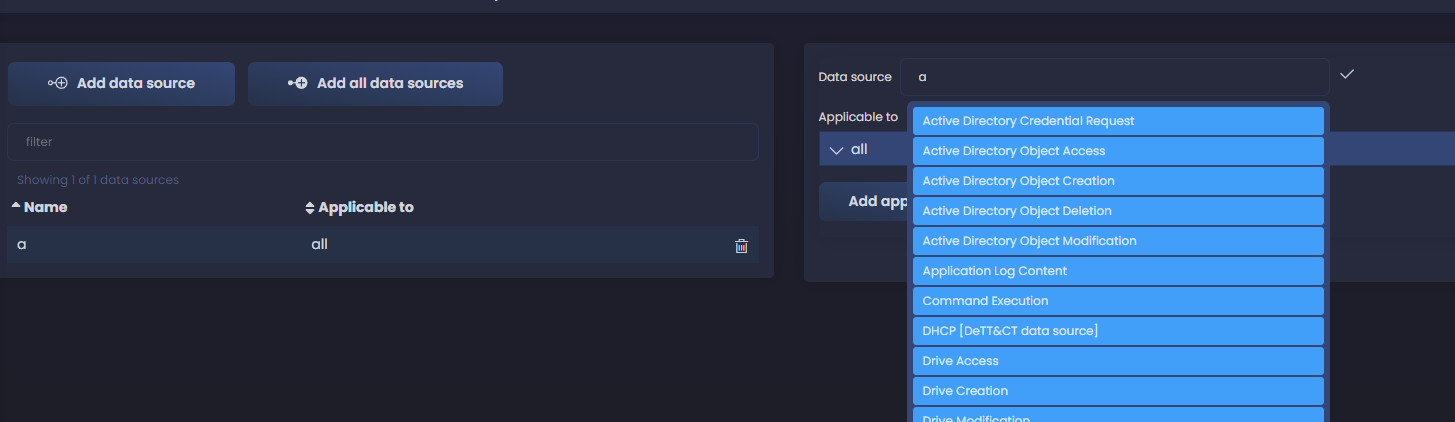
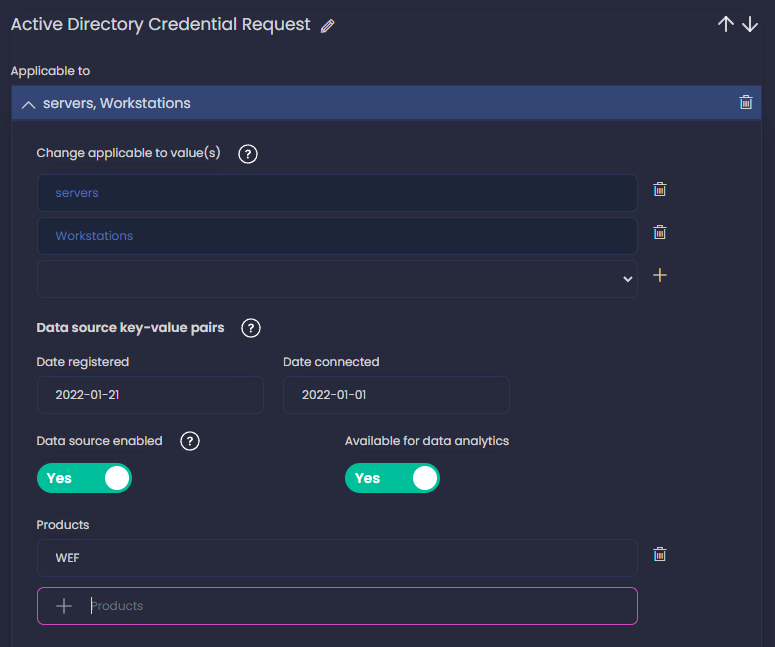
As we start typing, we get suggestions from the preloaded data sources. If we are collecting Windows logs, we can assume that Active Directory is a data source we are consuming, so let’s start with those ones. We select Active Directory Credential Request and start filling the fields. Click in Add applicable to and select the systems where you are collecting logs for this data component. I select both servers and workstations - you can use all as well if your data source is collected from all your systems; I add today as the date I registered this data component and also add a date of when we started collecting this logs - you can leave these empty if you don’t know when you started collecting them.
Next, I also enable the data source - you’d leave it disable if for some reason you are not getting the logs yet or the collection doesn’t work at the moment. I also enable Available for data analytics, this means that we store the logs somewhere - a SIEM - where later we can process them and use for detection. This doesn’t mean that we are already using them for detection, only that we can.
You can also add the products you are using to ingest the data source, in my case I set WEF as the product. See in the screenshot all the values I added.
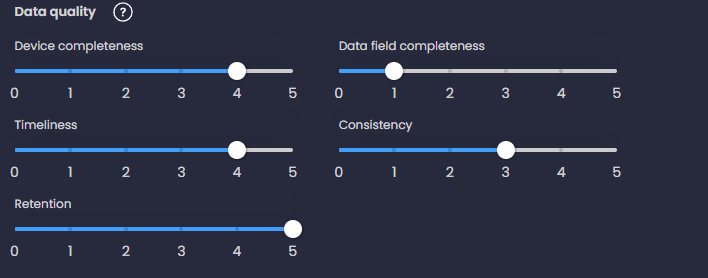
Next, let’s define the Data Quality further down the same section. If you click on the help icon ❔ next to Data Quality, you’ll see the criteria to complete the 5 dimensions:
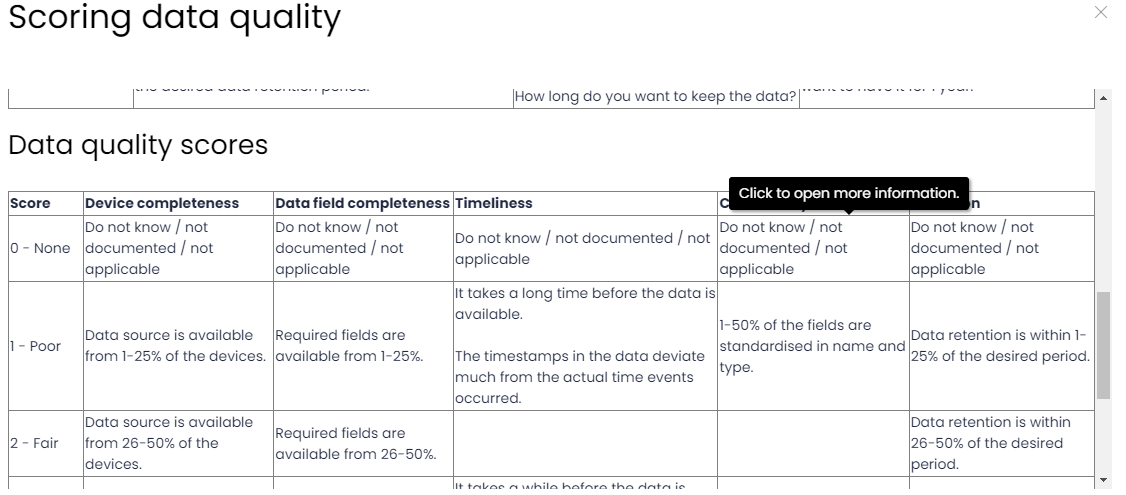
I’d suggest to be honest and convervative when completing this, you don’t want to get the false impression that you are collecting something in a way that later on will result in false negatives and missing attacks. Also be sure to be consistent across data components collected in the same way.
And that’s it, we have our first data component from our first data source!
We can now click on Add data source and continue ingesting all our data sources. It’s a tedious process, but later we will collect our reward from this.
Metadata to the rescue
Completing this task, when you are not sure if you are collecting a data source from the available list, or even if it’s applicable to you and should try to collect it, go to the Data Source or component metadata to get more insights. For instance, look at the metadata and details about Cluster data source:
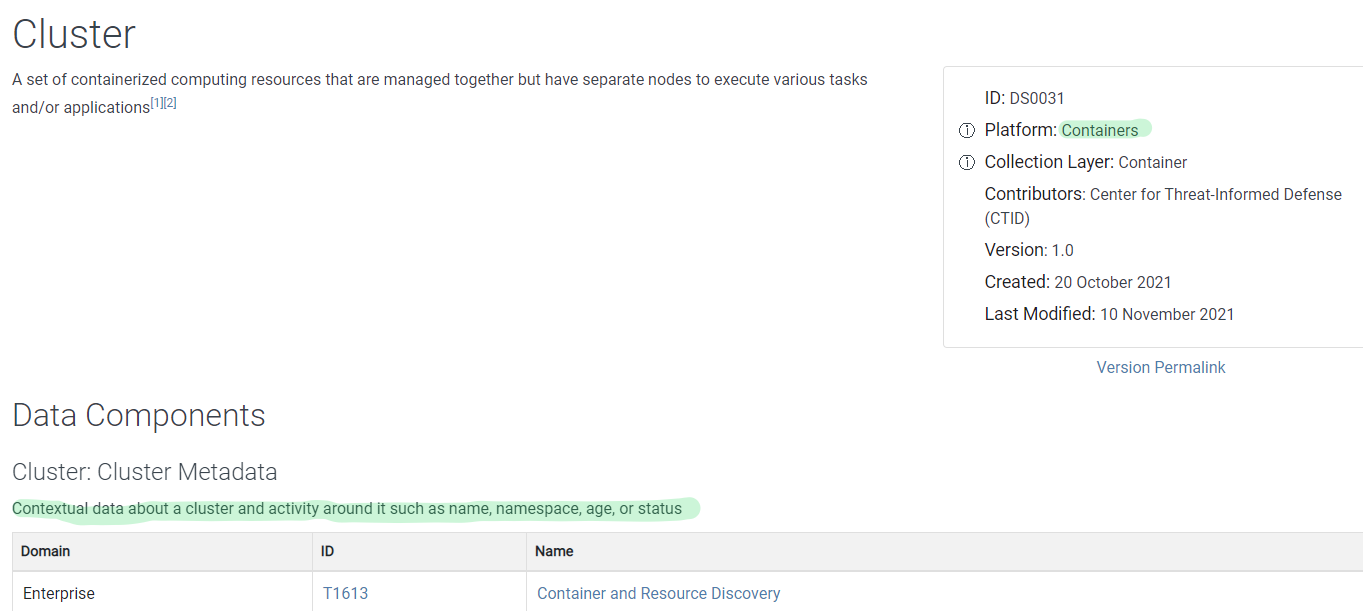
We can see it applies to containers, which if you don’t have in your environment, you don’t need to worry about.
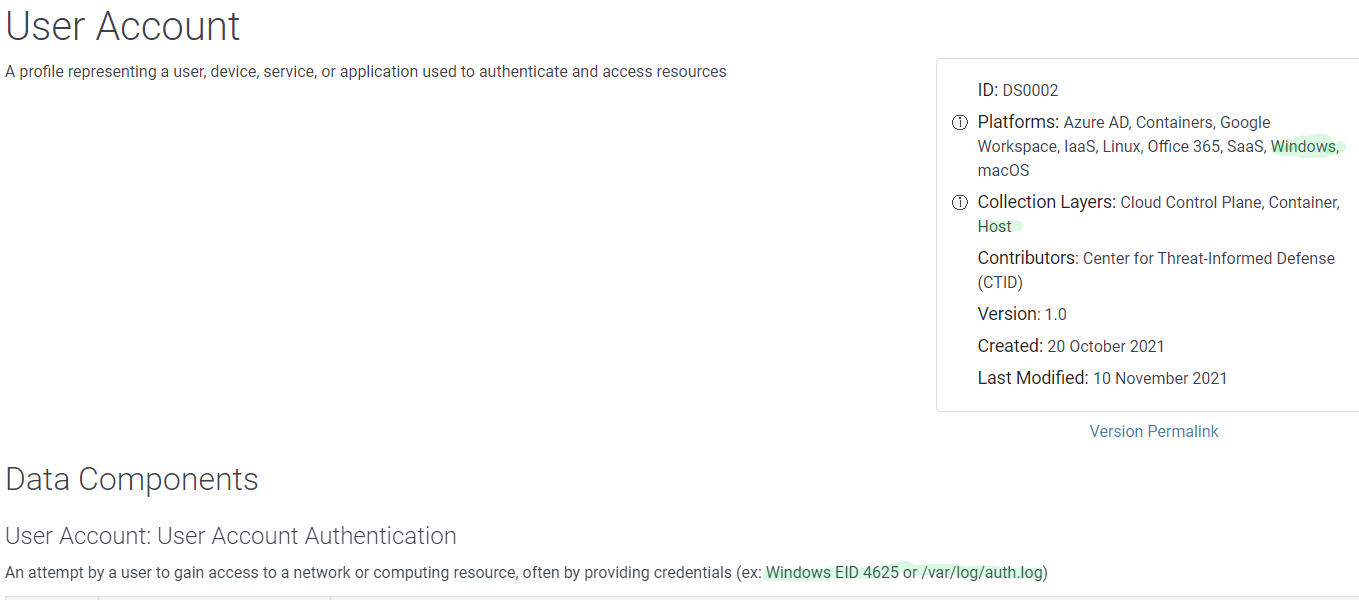
Let’s look another example, User Account, in the metadata we see platforms and collection layers, which helps me see that it applies to Windows and Host layers, both relevant to me; in the details of the components, we see techniques and subtechniques each one helps to dettect, but also examples of logs where this data source can be collected - Windows EID 4625 or /var/log/auth.log for Linux systems
ATT&CK Navigator
Once you have all your data sources loaded in the editor, we save the file and now we can generate a JSON file to use in the ATT&CK navigator for a mapping of our data sources to the TTPs in the framework. If you want to use the data sources file I created for this, you can find it here; I simulated a well configured Windows auditing environment where we get AD, group, user accounts and logon logs. This isn’t by any means perfect, we are just doing an approximation.
Notice I didn’t add Registry and Process data sources at all, this was intentional, you’ll see later why.
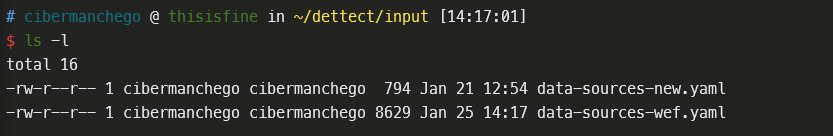
Place the data sources YAML file in the input directory on your system so it’s accessible from your dettect container.
Go to your dettect container:
docker start -i dettect
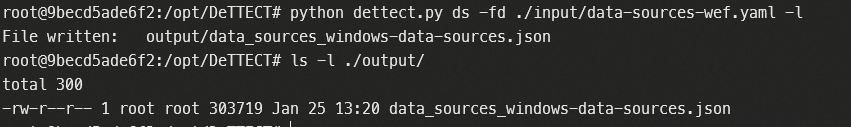
And generate the JSON file for the navigator app:
python dettect.py ds -fd ./input/data-sources-wef.yaml -l
You’ll see the file on the output directory.
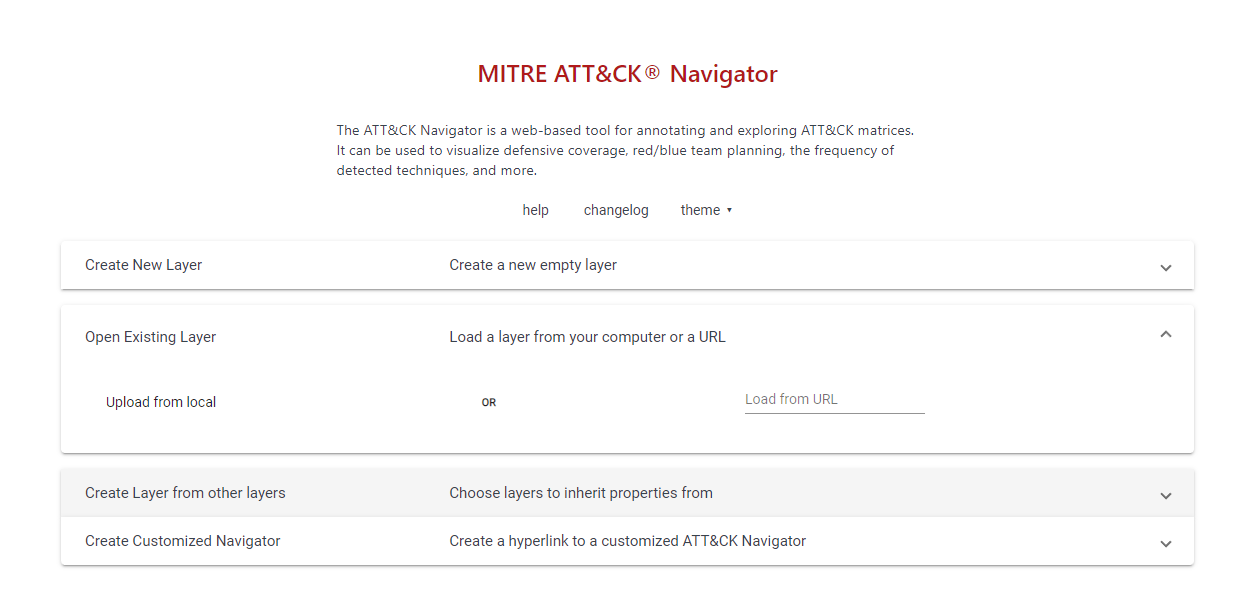
Now go to the navigator app in ATT&CK site here. Select Open Existing Layer and select the JSON file we generated.
This will open the app with our data sources loaded and mapped to the TTPs in the framework. You can also see that only the windows plaform is visible, as is the only one we loaded in our YAML file with the editor’s help.
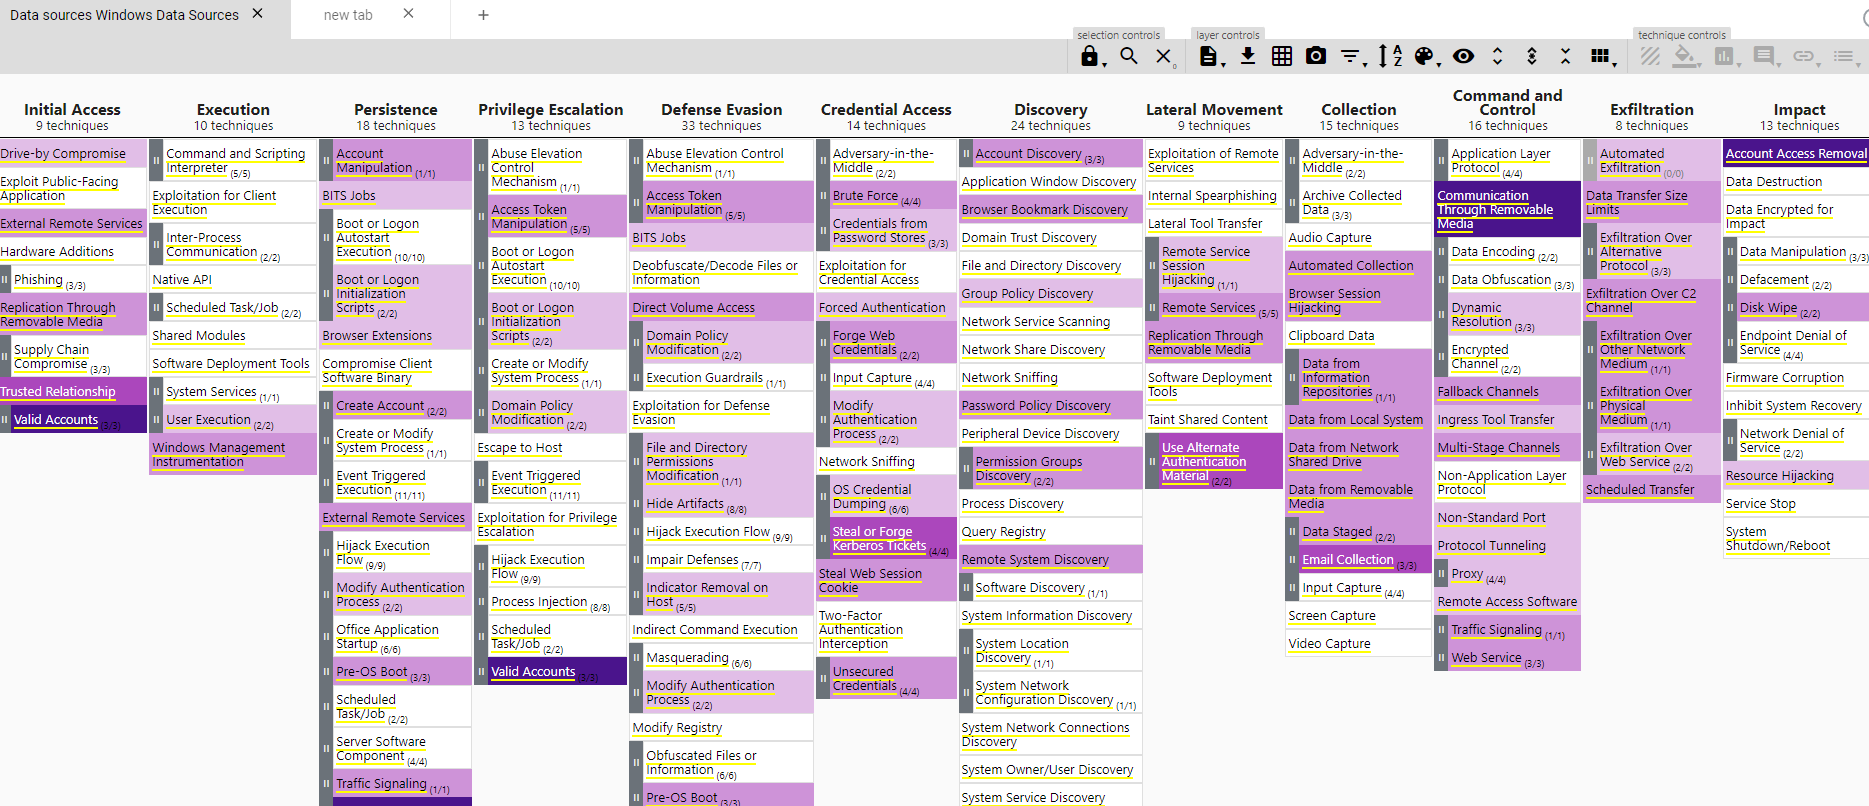
After the hard work loading our data sources, we get a visibility overview that those data sources provide; we can see straight away which techniques and sub-techniques we are missing with our current resources. Please consider this still a rough estimation of your visibility, where the darker the color the more data sources are covering an specific technique and the more possibilities for detection we’ll have.
We can already see where our gaps are and what we want to prioritize to start covering. Let’s say we want to get visibility in Command and Scripting Interpreter, which is white right now, we have no data source at all. We can just hover over it in the navigator and see which data sources would give us visibility, then we do our research on tools that can get us those data sources in our SIEM, like Sysmon for instance.
Next Step
We are still missing some pieces in the puzzle, though. We can also correlate this with our most probable threat actors; this is just the first step towards our threat assessment goal. Next day, we’ll expand on our data sources and get visibility scored per technique and then detections mapped to those as well.
You’ll see that following this method all the pieces fall in place naturally and we get a better insight in our threat landscape.
Stay tuned for the next installment coming soon!