See part 1 of this series here
Visibility
Last time we left with our data sources mapped to ATT&CK framework and already can see where we might be missing attacks to our network. Now let’s go a step further and get visibility scored based in our data sources plus our knowledge of the network. For that, we start the docker container for DeTTECT:
docker start -i dettect
Then we use the data sources file we generated in the first part - you can use my example file from here - to generate the techniques administration file with this command:
python3 dettect.py ds -fd input/data-sources-wef.yaml --yaml
That generates a YAML file we can then load in the DeTTECT editor and customize to our environment.

We then start the editor:
python3 dettect.py e
And load the file by clicking in the left menu on Techniques > Select YAML File then the new generated file.

We see now a list of all techniques for which we have data sources defined. They already have a visibility score defined automatically based on the number of data sources available - as added by us in first part - for each technique. For instance, for technique T1003.006, DCSync, we see a visibility of 1:
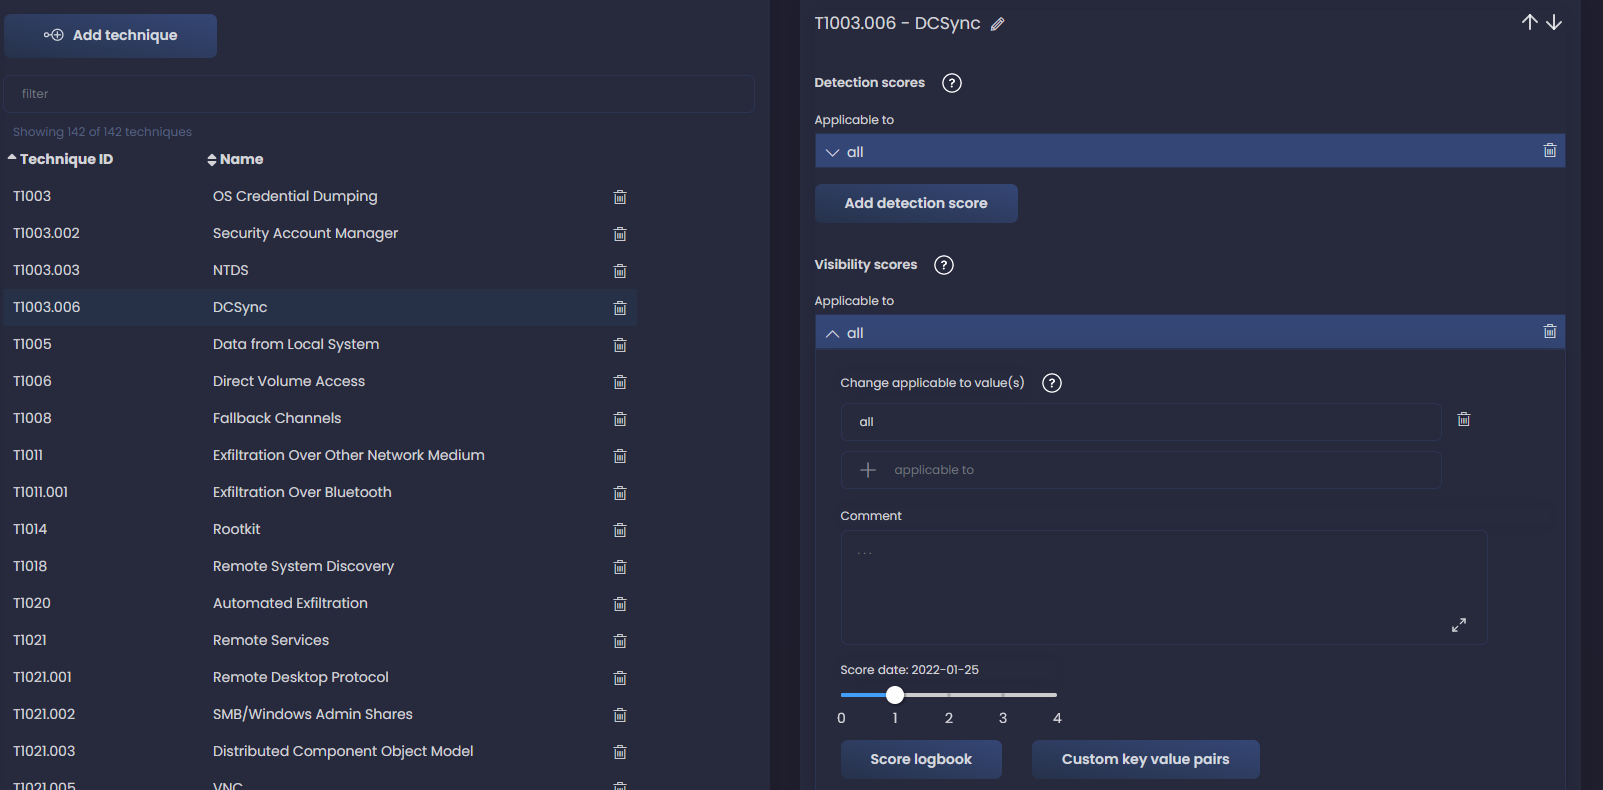
If based on our knowledge of the network we have confidence that this should be a 2, we can add a new score by clicking on Score Logbook and adding a new entry.

We add a comment for future reference as well. Adding a new entry allows us to keep track of our improvement and evolution of our detection capabilities.

We can do this to all techniques to ensure that visibility scores reflect the reality of our environment, then we can visualize it in ATT&CK navigator; don’t forget to save the YAML file before leaving the DeTTECT editor. We come back to the DeTTECT container and run this command to generate a visibility layer based on the new file:
python3 dettect.py v -ft input/techniques-administration-windows-data-sources_updated.yaml -l
And then we can load the new file in the navigator app:
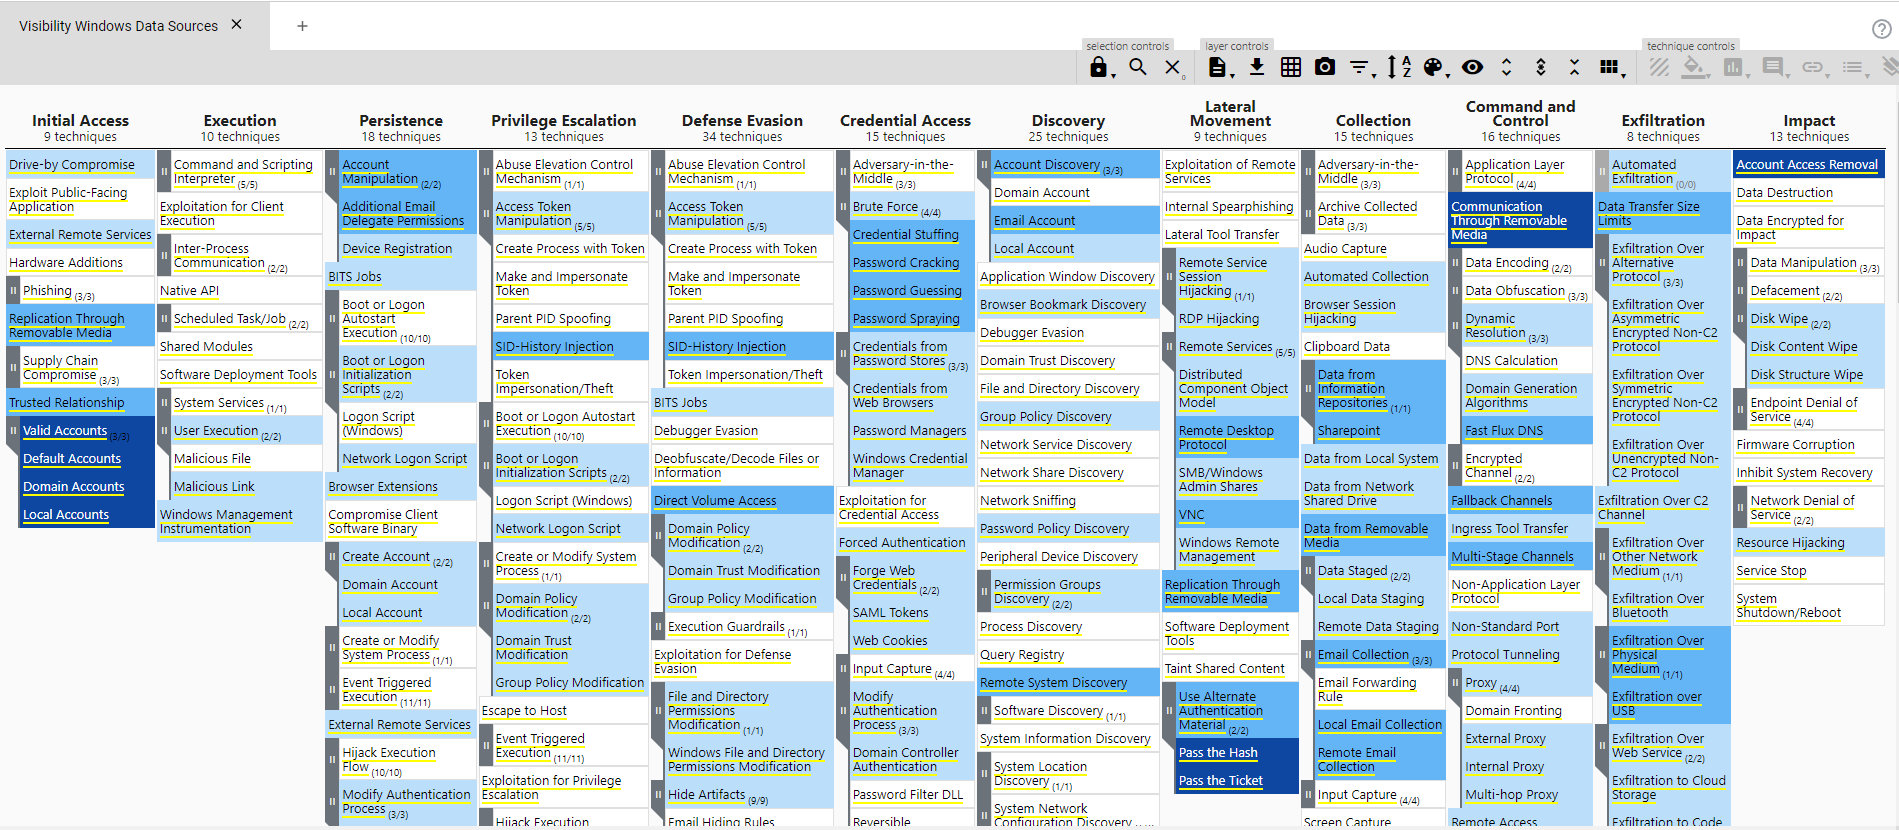
In there we can see different shades of blue depending on the visibility score assigned.
Now we have mapped what we can see based in our data sources, this is useful for instance if we want to cover a gap in our visibility, we go to the technique where we don’t have any view right now, see which data source we would need to cover it and try to add it to our environment via configuration of a current tool or addition of something new.
Detections
But we still don’t know if our detections correspond to our visibility, for that we can come back to the DeTTECT editor and load our techniques administration file again. This time we look at the Detections Score that by default are not added. The reason is that having a data source collected in our SIEM is not the same as having alerts or detection analytics configured to detect specific techniques.
Based on our network knowledge, and the guide here, we add the detections. We can also add the location of the detection for added context.
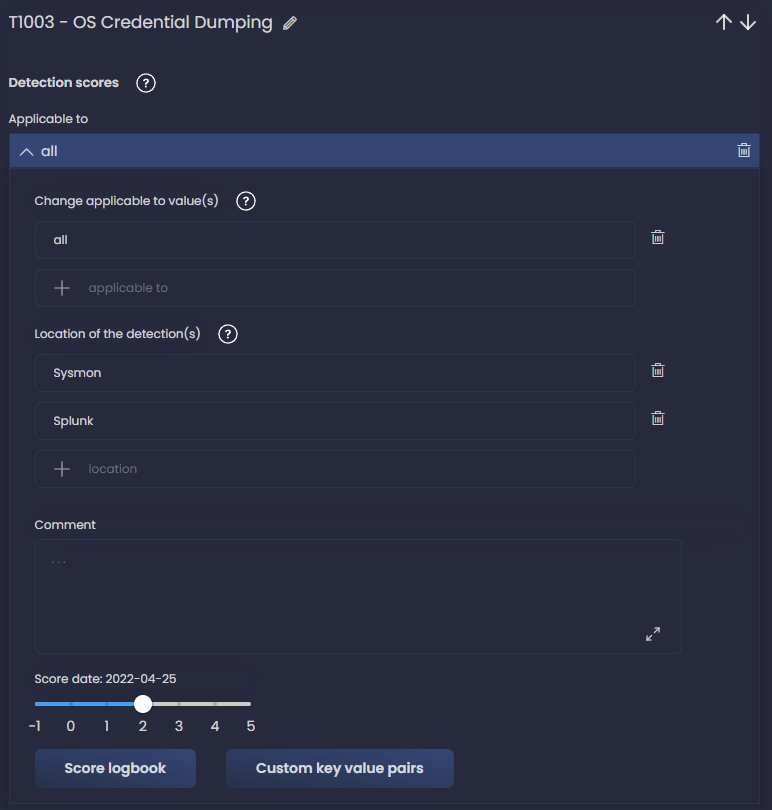
Let’s use an example; I go to the technique T1003 - OS Credential Dumping and click Applicable to all to expand the Detection scores section, then change to 2. I also add the location - we could be more specific and add the rule name from Splunk ES for instance.
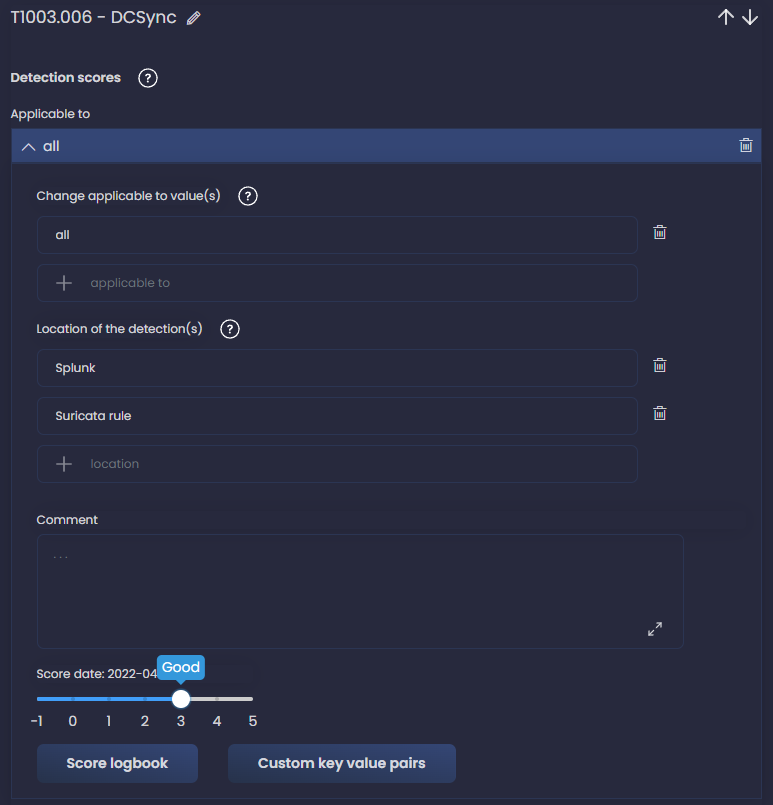
Another example with DCSync technique and adding also Suricata rule as the location.
We should do this for all our detections currently implemented. I know, it can be tedious, but once we are finished we only have to maintain it when new detections are added, which should be an easier task if we are consistent. In my case, it took us a couple of days to map our detections.
For our example, I’ll mark a few of the techniques with visibility as having detections in my example network, and then go to next step.
Let’s generate a navigator layer to display our detections in ATT&CK.
python dettect.py d -ft output/techniques-administration-windows-data-sources-windows_with_detection_scores.yaml -l
And now we can really see with some confidence what our gaps would be in case of attack, which techniques we wouldn’t get alerts from, regardless if we get logs ingested or not.
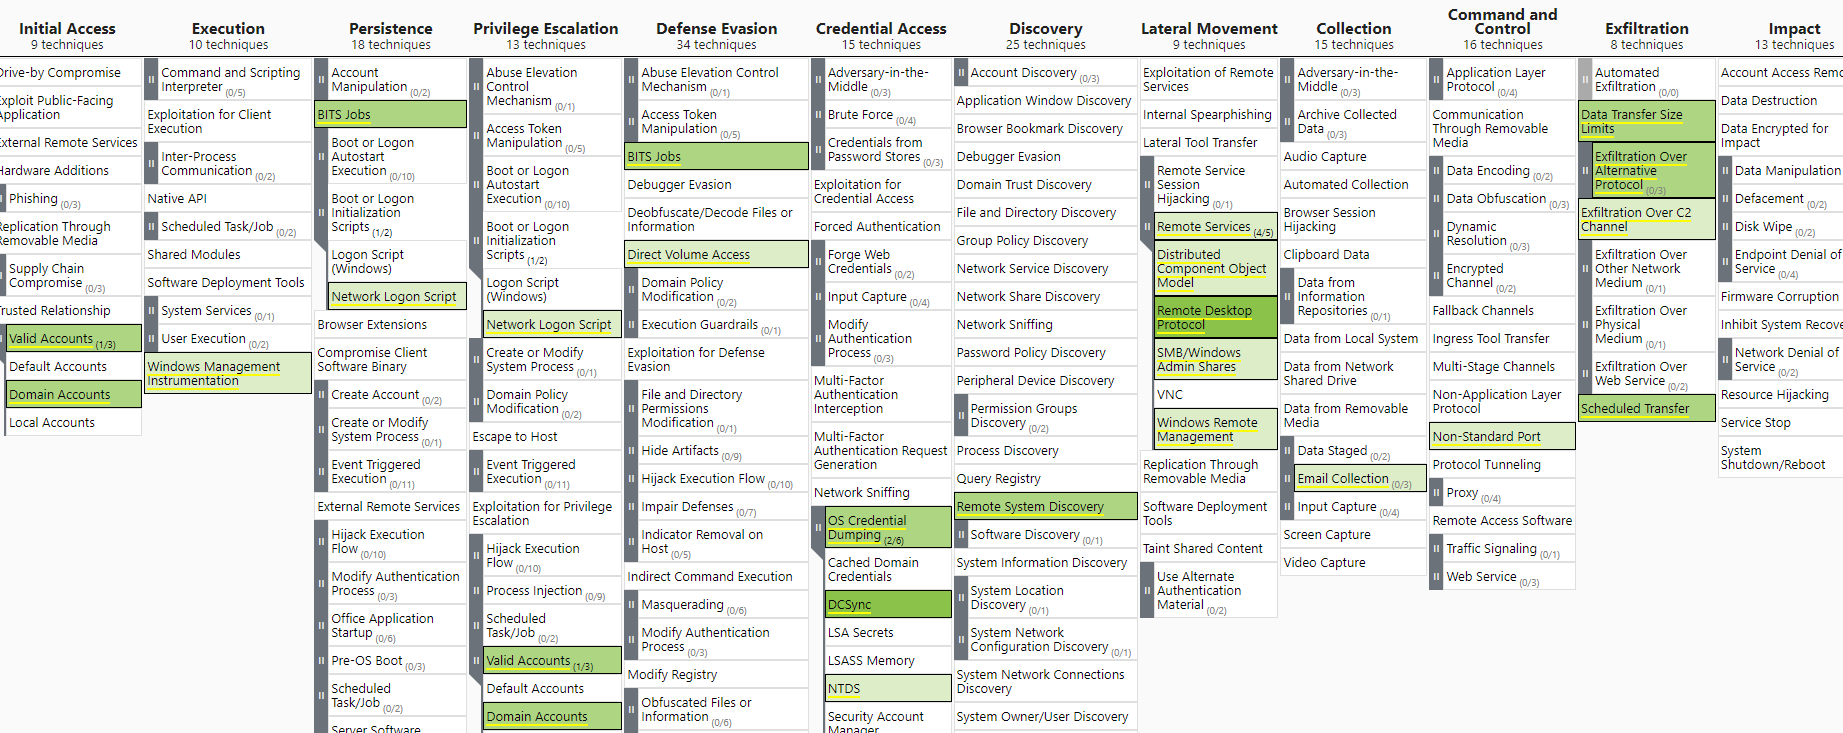
But how can we improve this detection map with our current data sources? Again we can use the ATT&CK navigator to aid us.
Visibility vs Detection
With the help of some ATT&CK navigator magic, let’s now cross-check our visibility and detection maps to get an idea of where we can focus our analytic engineering efforts. We open both layers in navigator, go to visibility layer, right click in any of the techniques and then select annotated.
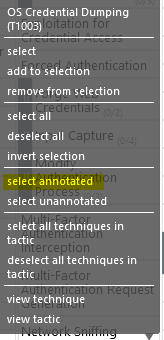
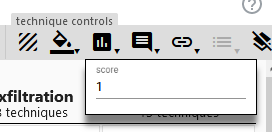
Next click in scoring and give it a score of 1 for instance.
These are all our visible techniques scored.
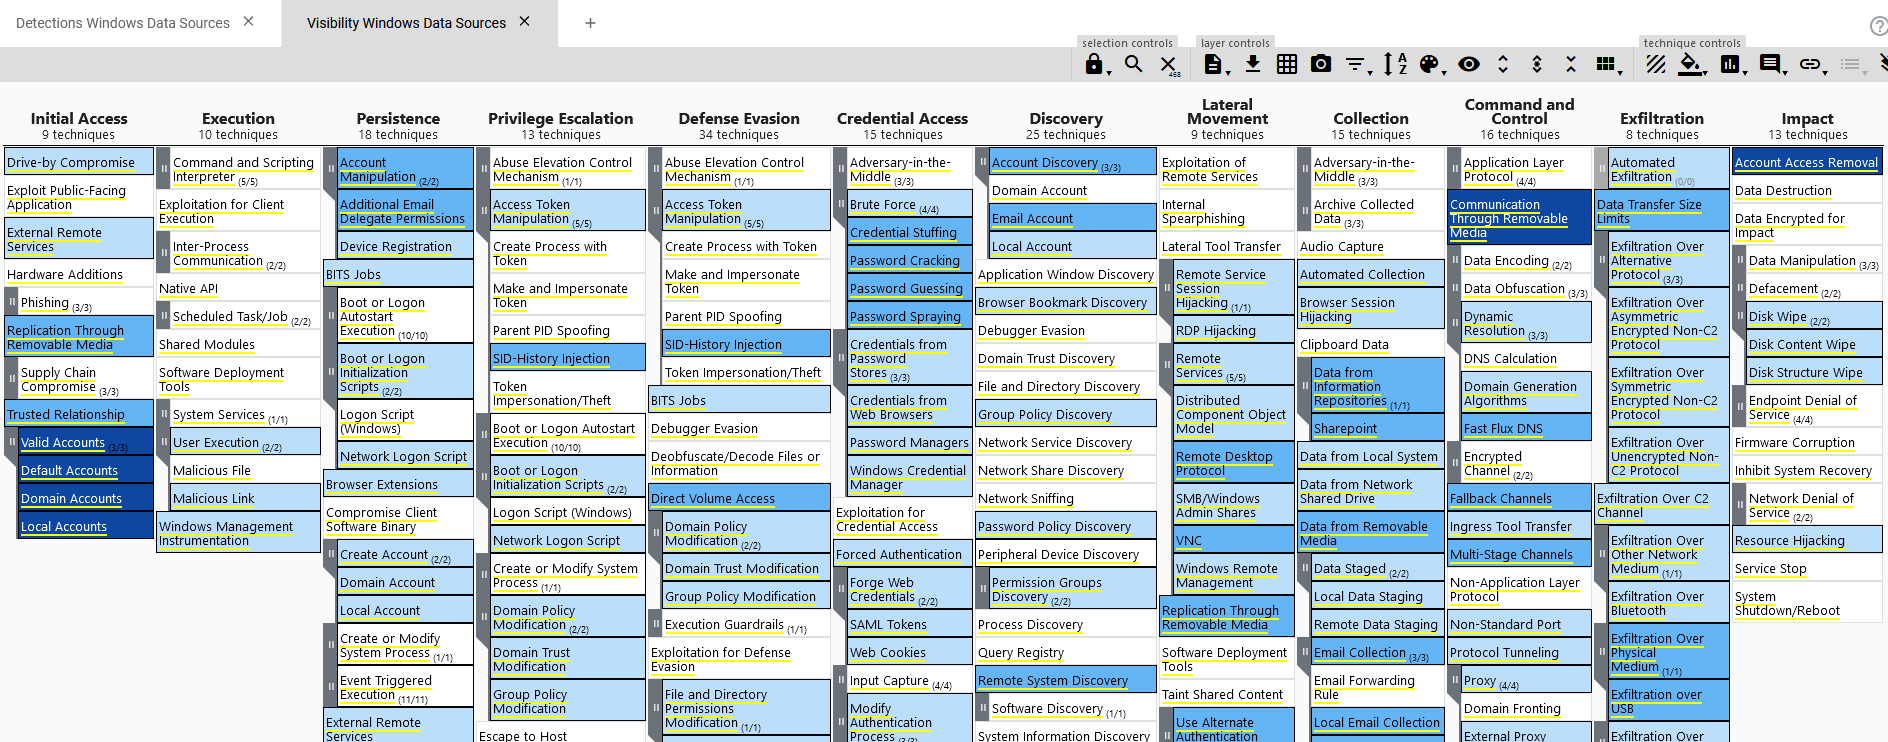
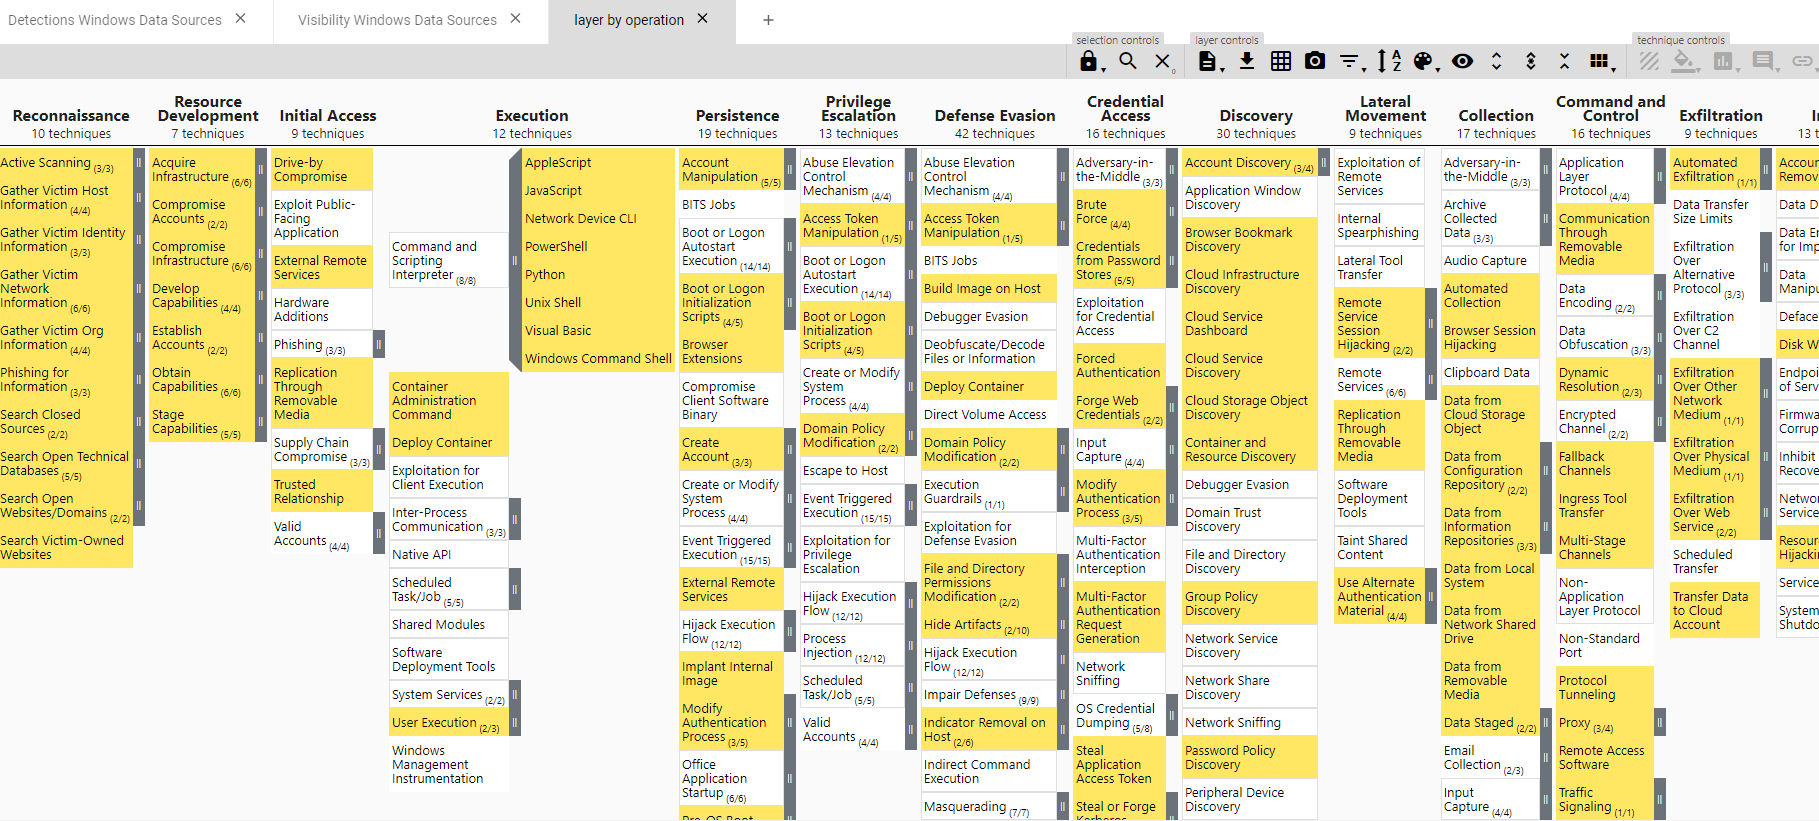
Then repeat the same process in the detections layer. With both layers having a score, we can build a new layer based upon these 2. Open a new tab in navigator and select the option Create Layer from other layers and use the score expression b and not a, where b is our visibility layer and a is our detections layer.

This will give us a new layer where we get highlighted which tehcniques we have visibility but no detections. Now we can work on developing dectections for these, as we know that visibility is there through the data sources we are collecting. These detections will not involve deploying new logging capabilities, as thanks to our previous work, we know that they are present.
See for instance Execution techniques like Powershell or Windows Command Shell, those are problably a good example of sub techniques that we should try to prioritize, specially knowning that we have data sources and visibility covering them.
Summary
So far we have identified our data sources, mapped our visibility to ATT&CK techniques (and our gaps) - which allows us to prioritize which data sources we need to incorporate to cover our visibility gaps. We have also mapped our current detections and cross-checked with our visibility - this allows us to find easy wins to add new detections, as we know that the necessary data is already being collected.
Next time we’ll see how to incorporate to this the concept of Threat Informed Defense, finding our coverage gaps for our network’s most probable threat actors techniques. That way we can focus our efforts on fixing the gaps where the risk of attack is higher for our organization, based in real life data.