Ransomware
Today, instead of working based on a supposed activity sector of my company, as I did in my last entry, I’m going to work on the most famous and common threat.
Ransomware continues to be the main threat for most companies of all sizes and across all sectors, as multiple reports from CTI companies demonstrate for the last few years. No shit, Sherlock, but what can we do about this if we don’t have a lot of resources at our disposal? Well following the same approach I did in all my previous posts about improving detections in our network, and with the help again of public CTI, I’ll show you how to operationalize these CTI reports from vendors and make them immediately useful for us to improve our security posture against the most prevalent threat we face.
I’m going to use an excellent report about Ransomware TTPs published by Kaspersky that you can find here. It dissects the TTPs used by the top 8 ransomware malware families, which is perfect for my purpose of developing detections and mitigations to defend this specific threat.
I recommend reading the whole report as it helps understanding how current human operated ransomware groups go from initial access to encryption and exfiltration of data.
From report to ATT&CK
Not all CTI reports are easy to translate to ATT&CK TTPs, but this one is very easy - basically the job is already done by them - so it’s a good one to start with. I’ll go a little bit further and create a heatmap in ATT&CK navigator based on the prevalence detected by the vendor.
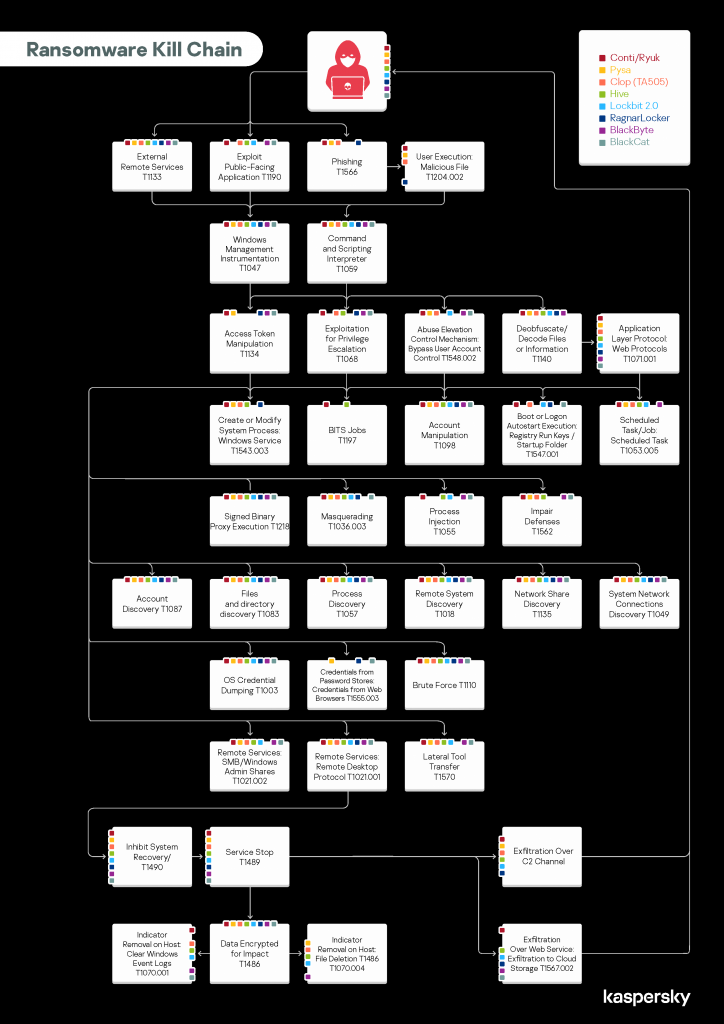
I open a new ATT&CK navigator layer and select every technique and sub-technique in the table and assign an score from 1 to 8. Then in the color palette I change low and high values to the correct range of my scoring:
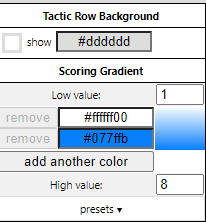
And just like that we get a heatmap - darker blue for more prevalent techniques - of Ransomware TTPs from the most prolific malware families. You can get the JSON file from here if you want to see for yourself.
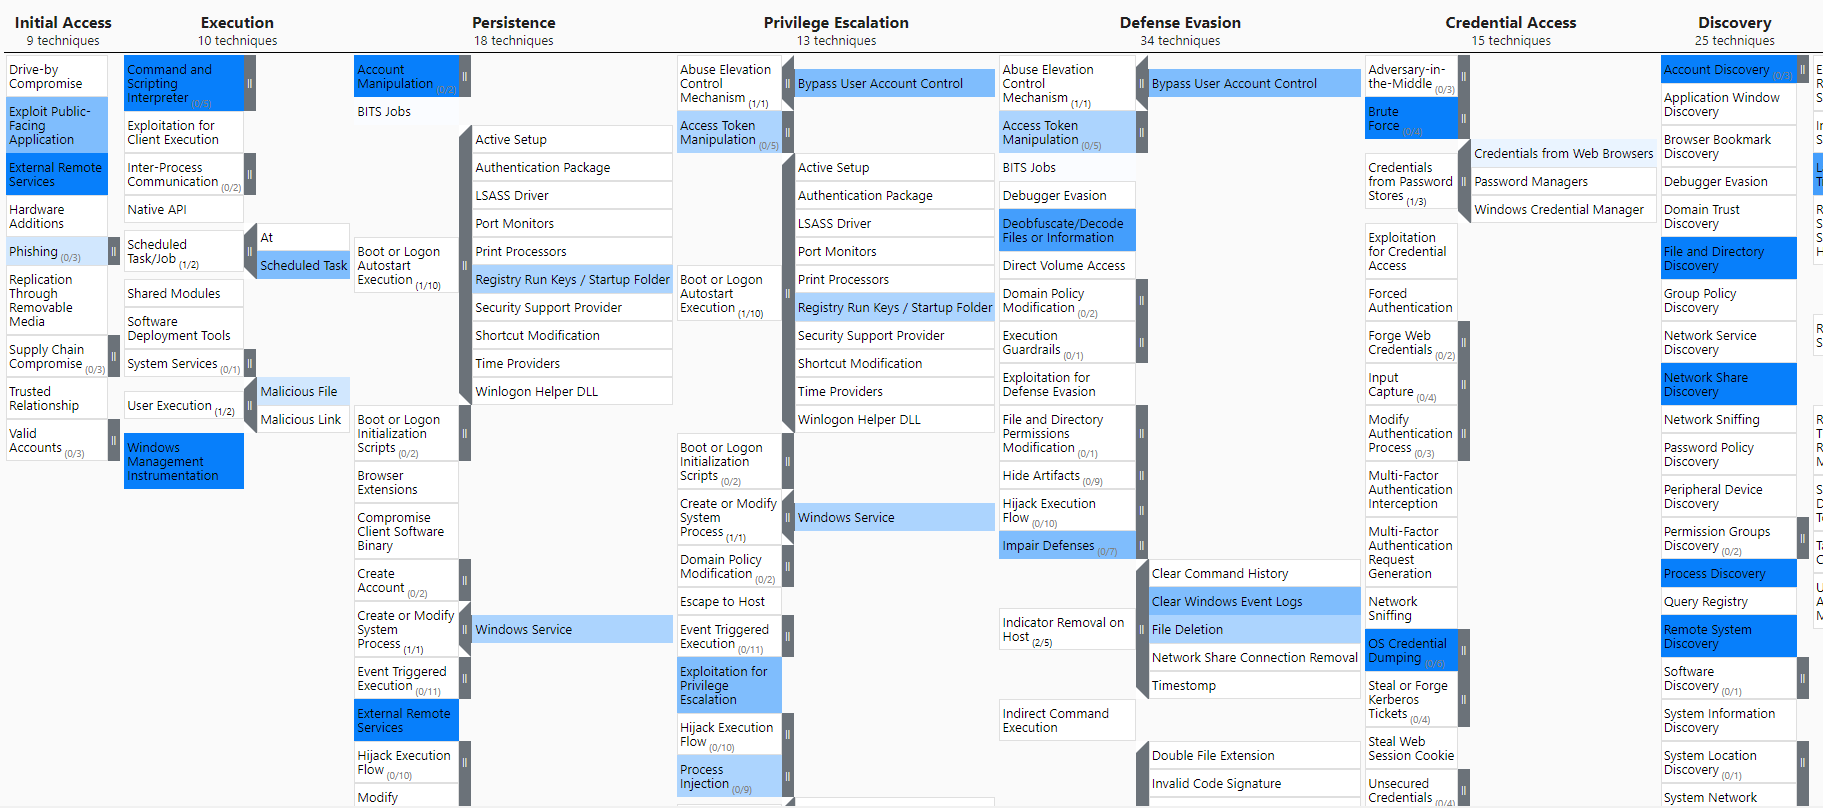
Easy-peasy, the hard work was already done by the Kaspersky analysts, we just translated it in something we can work with.
Gaps Everywhere
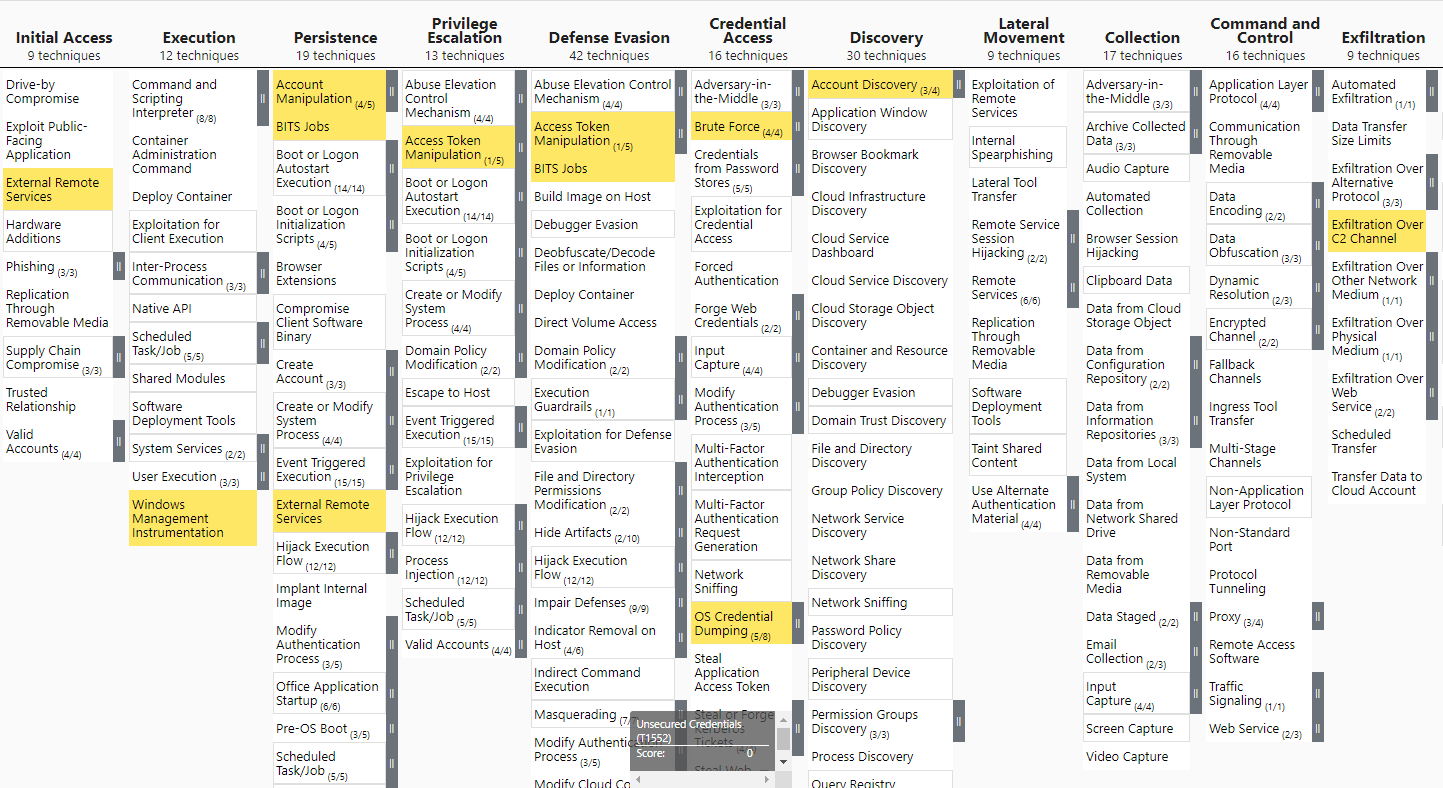
Let’s go a bit deeper and use our previous work to see where we can find quick wins. I load in navigator my layer with Visibility and no detection, which is already scored. Now we open a third layer, select Create layer from other layers and in score expression enter a and b, then click in create.
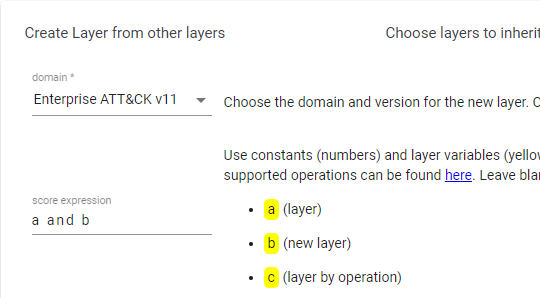
This gives us TTPs most used by Ransomware groups where we have visibility but no detection analytics yet. Those should be our first priority, as we already have the data, so no additional work needs to be done there, just work in the detection.
Sigma rules
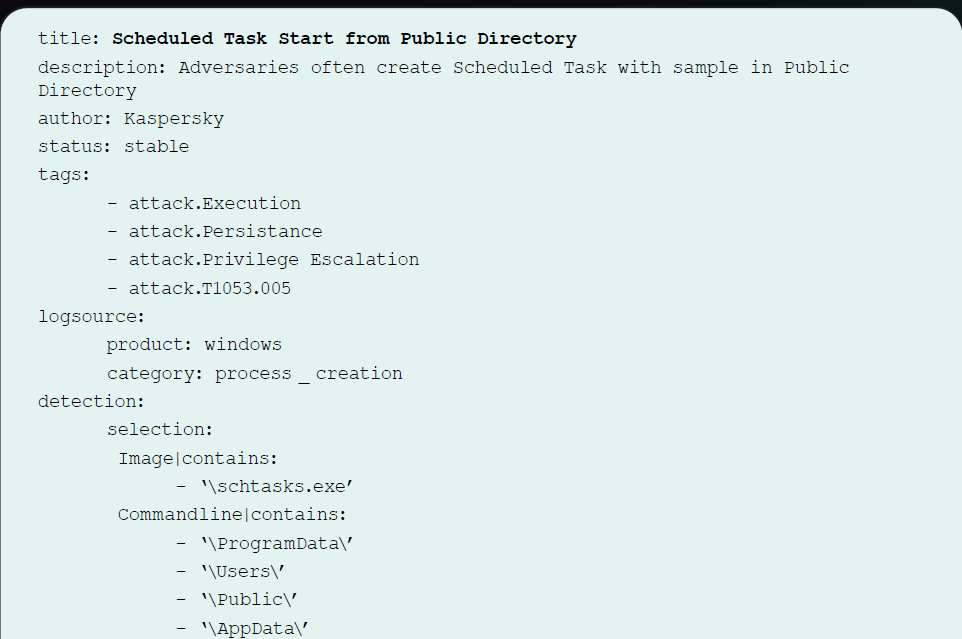
Again, let’s go a bit further, as the report also provides Sigma rules for the TTPs identified, we can work with them and translate it to detection analytics in our network. In a Ransomware attack, we want to detect - and mitigate - as early as possible on the kill chain; that means the more to the left on the ATT&CK map, the better.
I will use T1053.005 - Scheduled Task Start from Public Directory - as an example, as it’s not covered by our detections and is quite early in the kill chain. I copy the sigma rule from the report and create a YAML file.
From Threat report to detection rule
Now, there are several ways of translating this to an alert for our SIEM - in my example I use Splunk, but there plenty of platforms available for conversion. For instance, you can use sigmac. I will use an online tool, free and really versatile, Uncoder.io Go in your browser to that URL, on the left paste our sigma rule, on the right select your translation target, in my case Splunk, and click translate; we get a pretty functional Splunk query:
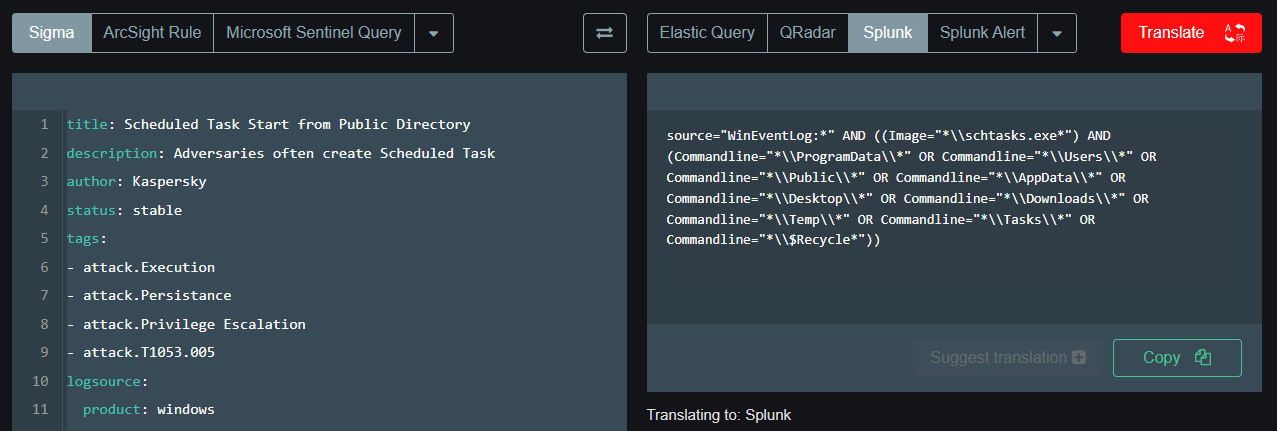
This is the resulting query:
source="WinEventLog:*" AND ((Image="*\\schtasks.exe*") AND (Commandline="*\\ProgramData\\*" OR Commandline="*\\Users\\*" OR Commandline="*\\Public\\*" OR Commandline="*\\AppData\\*" OR Commandline="*\\Desktop\\*" OR Commandline="*\\Downloads\\*" OR Commandline="*\\Temp\\*" OR Commandline="*\\Tasks\\*" OR Commandline="*\\$Recycle*"))
We can use this now to create a notable event in Splunk ES or use another target SIEM and adapt to our environment.
Conclusion
We have seen today how to work from an public threat report to produce a new detection rule in our network, all based in real world threat data and tailoring it to our network to make immediately usable. This was easy thanks to the high quality of the report from Kaspersky analysts and our previous work mapping our own capabilities. Still, we shouldn’t settle for one single intelligence source for our risk assessments and detection work, collate multiple sources and cross-reference with your own internal inputs for well rounded strategy.
The next step in our threat informed defense strategy would be applying mitigations to the TTPs detected, which are also included in the report, divided by tactic and techniques.
We’ll see how to take those mitigation ideas and translate them to another MITRE tool, D3fend, this will help us choose the right mitigation for each Ransomware technique.
Hasta la vista!